


On a chart, patterns are recognisable shapes that are formed by the prices of security at several points in time. A line that links various price points over a certain period of time, such as opening prices, highs, and lows, indicates a pattern.
These price points can include closing prices as well. Chartists look for data trends to make educated guesses about where prices will be heading in the future. Technical analysis is built on patterns, which serve as its foundation.
There are a lot of patterns in trading that reflect the bullish or bearish situation of the market.
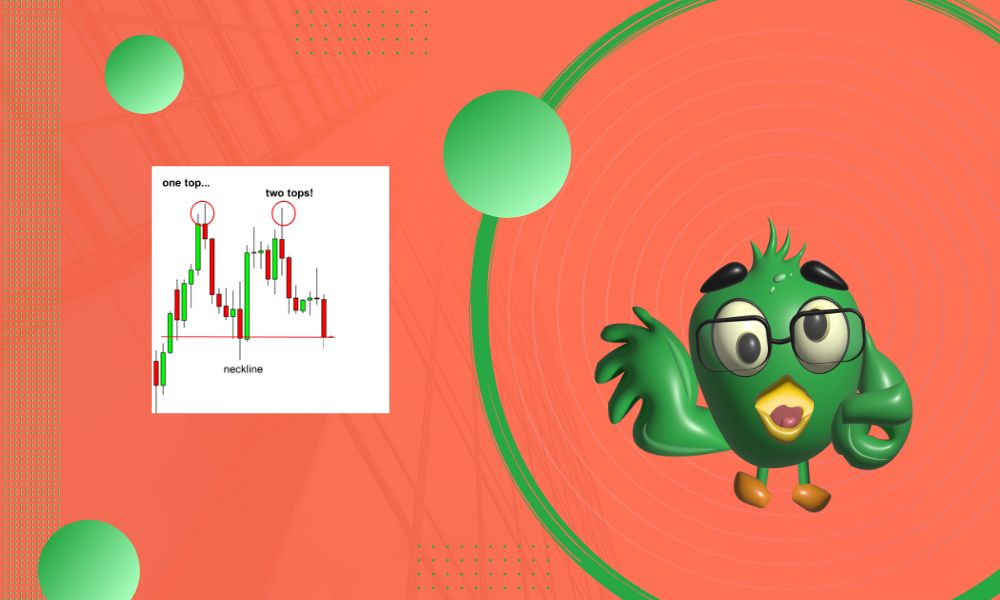
A double top is a bearish reversal pattern. It consists of two peaks on a support level called the neckline. The initial high will retrace to the neckline soon, following a strong bullish trend. Once it reaches this level, the momentum will once again turn bullish to construct the second peak.
For the double top pattern to be verified, the trend must retrace further than it did following the initial pullback after the first peak.
Typically, this indicates that the price momentum has broken through the neckline level of support and that the bearish trend will persist for a medium- to long-term.
Traders that employ the double-top pattern in their market activity will typically attempt to establish a short position at the second peak in preparation for the bearish reversal that the pattern occasionally predicts.

Towards the end of a bullish market, the double top is a regular phenomenon. The price formation resembles two peaks that occur in succession.
On a price-versus-time chart, the peaks have a similar price. The peaks contain a separation or parting, which represents the lowest price.
The division is also referred to as a valley. The price level near the valley is known as the formation's neckline. When the price falls below the neckline, the price formation is deemed to be complete.
It indicates that the price is likely to continue falling or that a further price decline is imminent.
The double top pattern indicates to an investor, trader, or analyst that buyers are prevailing in the market, with demand exceeding supply prior to the development of the first top.
It leads to price increases. The pattern is then reversed, and sellers begin to dominate the market, resulting in supply surpassing demand. As supply exceeds demand, prices begin to decline.
It generates the price valley or neckline. Following the trough, the bulls or buyers in the market retake the upper hand and prices begin to increase.
When traders observe that prices are not increasing above the level achieved by the initial peak, bears or sellers may gain the upper hand, leading to a decline in price levels.
It leads to the construction of a double top. If prices fall below the valley, it is often a bearish indicator.
Volume and time between peaks are two characteristics that enable analysts or traders to establish the existence of the double-top pattern.
When analysing volume, it is instructive to notice that the level in price to the first peak can be linked to an increase in volume. The subsequent decline in the neckline can be attributable to low volumes.
The volume levels of the second effort leading to the second peak should similarly be low.
When examining the time interval between the two peaks to determine whether or not a double top pattern is present, it is useful to keep in mind that when the peaks reach the same price levels within a short period of time, this is a sign that the trend will resume and that they are part of the consolidation.
Read More From ForexScopes:
Forecast For The Euro/US Dollar On October, 2022
Walmart's Roblox Experiences Target Younger Shoppers -ForexScopes
IC Markets Offers A Program To Assist Traders In Soaring -ForexScopes


